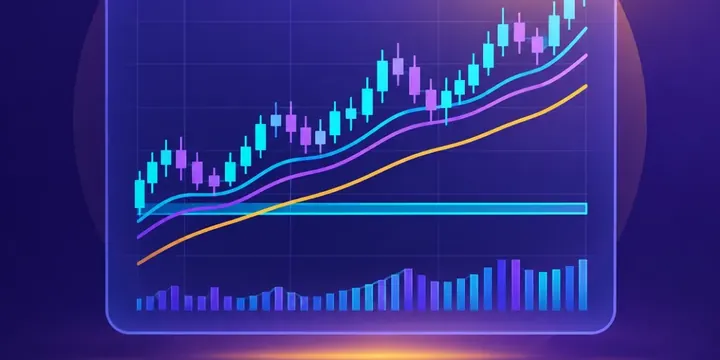
The essentials
- Each candle shows open, high, low and close for one period.
- Longer timeframes, such as weekly candles, filter out much of the daily noise.
- Patterns describe past trading; they do not reliably predict what comes next.
Anatomy of a candle
A candlestick summarises trading over one period: a minute, a day, a week. The thick body runs from the opening price to the closing price. If the close is above the open, the body is usually shown green or hollow; if below, red or filled. Thin lines above and below, called wicks or shadows, mark the highest and lowest prices reached.
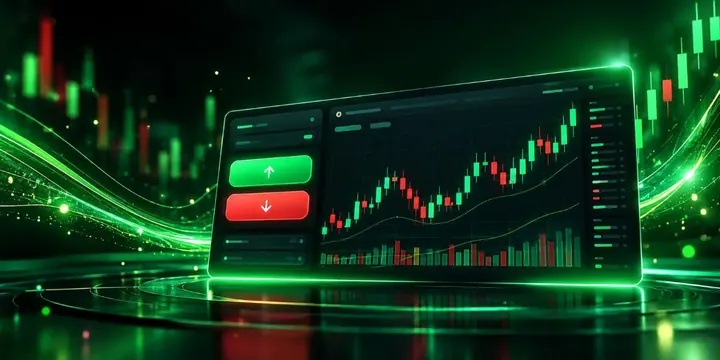
Reading one candle
- Long body, short wicks: price moved steadily one way and closed near the extreme.
- Small body, long wicks: buyers and sellers pushed price around but it ended near where it started, showing indecision.
- Long lower wick: sellers pushed price down but buyers brought it back up before the close.
Choosing a timeframe
Long-term investors often find weekly or monthly candles most useful, because they smooth out daily swings and show the broader trend. Traders use hourly or even minute candles. The same share can look like it is falling on a 5-minute chart and rising on a weekly one.
Common patterns
| Pattern | Description | Commonly read as |
|---|---|---|
| Doji | Open and close almost equal | Indecision |
| Hammer | Small body at the top, long lower wick, after a fall | Possible slowing of selling |
| Engulfing | A candle whose body covers the previous one | Possible change of direction |
| Gap | Opens well above or below the previous close | Reaction to news, often results |
Add volume
Most charts show trading volume beneath the candles. A large move on high volume suggests broad participation, such as after company results. The same move on thin volume may carry less weight.
Know the limits
Studies of chart patterns show mixed results, and any edge tends to shrink after trading costs. For long-term investors, charts are most useful for seeing history at a glance: how deep past falls were and how long recoveries took. They say nothing about a company's profits, balance sheet or valuation.
Reader questions
Should long-term investors use candlestick charts?
They can help visualise price history, but decisions for long-term holdings are usually based on diversification, costs and fundamentals rather than chart patterns.
Why are candles red and green?
It is a colour convention for falling and rising periods. Some platforms use other colours, and in some markets red means rising.